The Science: Qfly research
Click on images to enlarge.

Click on images to enlarge.
 We know that the amount of high-quality hosts in the surrounding landscape is a strong predictor of greater suitability for Qfly. This information is from habitat-suitability modelling based on expert elicitation and a climatic niche model (CLIMEX) and provides an indication of where Qfly could be within your region.
You could collect this data for your region to help you better understand where flies might be. The type of data you need relates to;
We found that in all landscapes there is adequate habitat all year round, and that many regions in south eastern Australia are not climate limited, hence hosts being the strongest predictor.

Conceptual model of habitat suitability indicating the environmental variables identified by experts to determine if Qfly populations can persist in the landscape. Numbers represent the strength of each environmental variable in predicting Qfly suitability. For example, host availability (1) is the strongest predictor for Qfly suitability, which is driven mostly by host preference (1a) followed by host duration (1b) and then host cover (1c).

Habitat suitability for the Goulburn Valley–Murray region. This is a case study where Qfly populations are already established. Note the difference between suitability in the north and south of the region; this is driven by cold stress. Hence, habitat is optimal in places in the north of the region, but only reaches sub-optimal in the southern parts of the region.

Habitat suitability for the Sunraysia region. This is a case study where the Qfly populations are in early establishment phase (under 5 years), and there may be areas within this region where Qfly has not invaded.
Risk maps estimate habitat susceptibility to Qfly. They incorporate monitoring data along with habitat suitability data and other information elicited from experts (such as dispersal pressure) at a monthly timescale.
Risk maps are most valuable when they are put into practice.
Here is a video of project team member Justine Murray, working with the Mildura Qfly management group, putting the risk maps into practice in Sunraysia:
The monitoring data used to construct risk maps is commercially sensitive, so we are unable to show the risk maps constructed for our key case study regions of Sunraysia, Riverland and the Murray–Goulburn Valley online.
You can request the risk maps provided you have access rights to the data they contain.
Regions with established fly populations commonly see a drastic increase in fly numbers in their monitoring traps during the early spring season (mid- to late August).
Focusing efforts to reduce the number of flies during spring (especially females) potentially reduces the population of flies throughout the whole season.
However, to achieve this high impact, our simulation modelling has shown that it is important to target female flies before they have had a chance to lay their eggs.
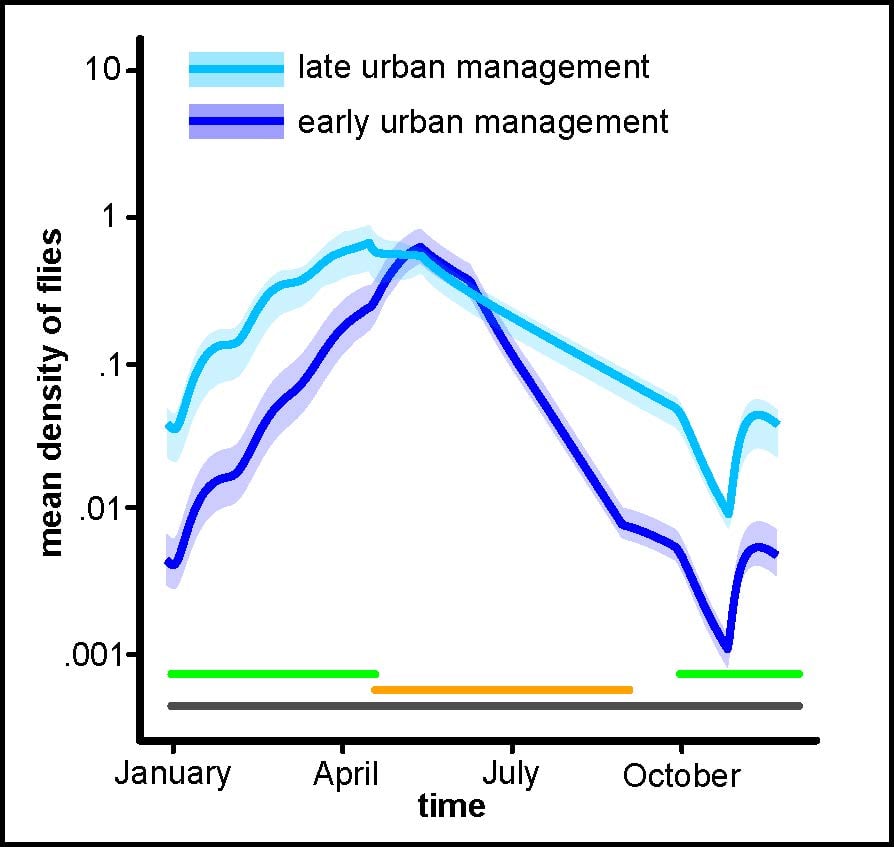
Estimated Qfly population densities in urban areas over time from the spatial simulation model, showing the effect of early (Jul–Sep) versus late (Jan–Mar) management.
In a similar way, population numbers can be significantly reduced by targeting areas that have been repeatedly shown to be a source of flies.
For example, our simulation modelling in an urban landscape shows that targeted management of Qfly throughout the year can result in very good pest suppression.
If only partial management is possible (for example, due to budget restrictions), then the recommendation would be to target early populations (as above). We have demonstrated with the model that this is the most effective.
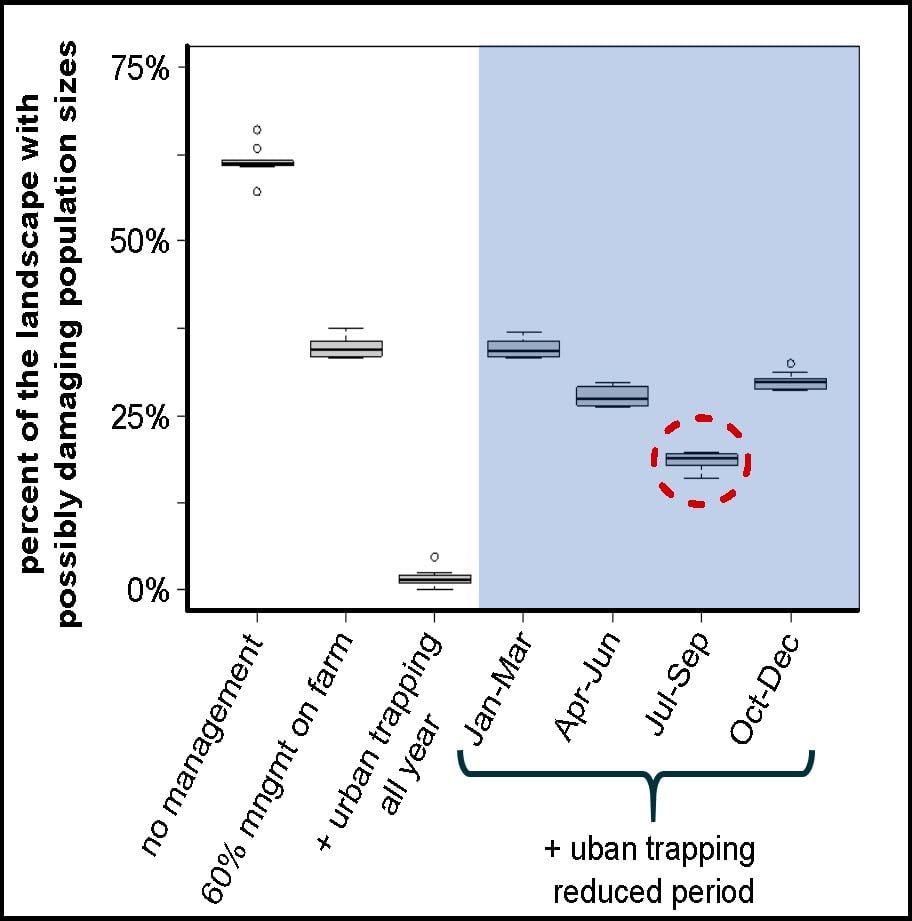
Result of simulation modelling in an urban landscape, showing that trapping all year can be very effective at suppressing flies. When that is not feasible, focusing trapping in the 3rd quarter (spring) is likely to be the next most effective option.
Simulation models that looked at the effect of management strategies on Qfly population dynamics showed that on-farm BMP can significantly reduce fly numbers when adopted over a large enough area or by enough people.
Increasing the area of land under management with existing tools has a strong effect on fly numbers and the extent of pest suppression over an area.
At the same time, how effective management is depends on landscape composition, such as the consecutive availability of hosts. In urban areas there can be a wide variety of hosts (and therefore extended host availability), so if there is an urban area in your landscape it is important to manage it.
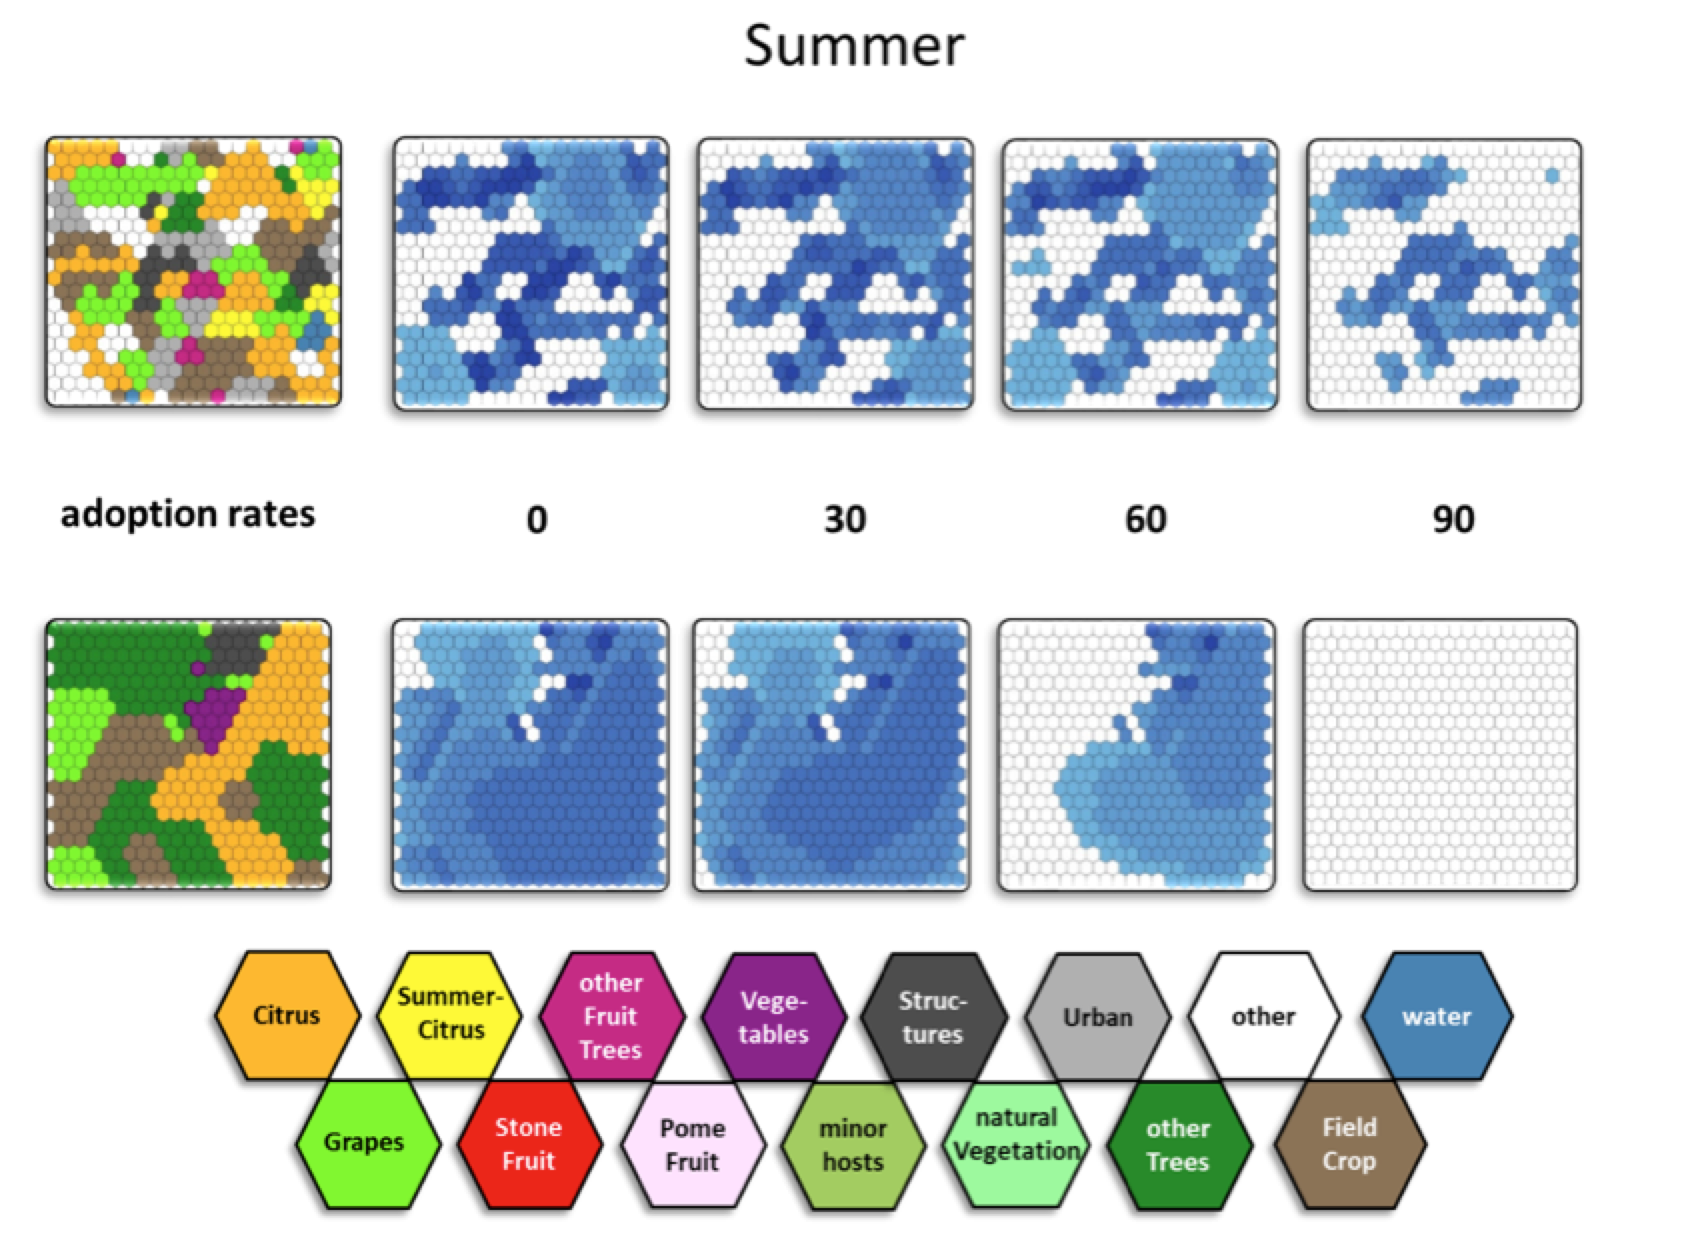
Results of 2 contrasting simulation model scenarios, showing that increasing rates of landscape managed is important to achieve area-wide pest suppression. However, in some landscapes, this will be more effective than others. When there is a significant urban area in a landscape, other strategies will also need to be employed to target those urban areas.
 A large-scale social survey was conducted to examine the important barriers and facilitators of AWM and sterile insect technique (SIT) uptake.
The survey was completed by growers, stakeholders and members of the general public in 3 horticultural regions in eastern Australia.
Analyses of regional differences show us that:
Thus, the Murray–Goulburn Valley presents a more challenging context for AWM implementation. The area would require preliminary ‘groundwork’ to create an environment that is receptive towards AWM and implementing it.
Overall, the regions scored highly on social and community indicators. Most participants felt a sense of moral responsibility to help their region manage Qfly, and there was a strong belief amongst individuals that their friends and family would also be willing to approve of AWM as a way of controlling Qfly. Participants felt a personal responsibility to help their community.
Results showed that being a farmer did not significantly influence someone’s intention to implement AWM; both farmers and the general public were keen to be involved. The most important factors contributing to participation in AWM were:
Participants would be more accepting of an AWM initiative if it were fair, simple and advantageous with observable benefits and impacts.
Regarding design rules for local AWM, participants overall indicated a high willingness to abide by rules. Growers indicated a high preference for close monitoring of others to ensure compliance, and a lower preference for enforcing compliance through penalties. This suggests an informal process of ensuring participation in AWM would work best, such as checking in with neighbours with whom growers have a good relationship, or encouraging indirect methods for compliance (such as using incentives for those with integrated control options on their properties).

Two region-wide surveys – one for growers and one for residents – were conducted in the Murray–Goulburn Valley and Sunraysia during February and June 2017. The survey was to find out how much growers and residents felt willing to pay for the various features of an AWM program and sterile insect technique (SIT).
Murray–Goulburn Valley growers indicated a willingness to pay on average $500 per hectare per year (minimum of $330 per hectare per year and maximum of $680 per hectare per year) for an AWM program that features Qfly management in town and residential areas, and SIT.
Sunraysia growers indicated a willingness to pay varying amounts, depending on what sort of features the program contained, up to $700 per hectare per year for a complete program of male annihilation technique (MAT), Qfly management in town and residential areas, and SIT.
 Grower willingness to pay (maximum, average, minimum) estimates ($ per hectare per year) for features of an AWM program in the Murray-Goulburn Valley (orange circle) and in Sunraysia (blue triangle)
Residents in MGV and Sunraysia indicated a willingness to pay for various features of AWM. Residents were willing to pay most for SIT, up to an average of $122 per household per year in Sunraysia. In both regions, residents appeared to favour organic traps over traps that contained insecticides. There was little difference between netting over tree removal, indicating that both are acceptable and substitutable.
 Resident average willingness to pay estimates ($/household/year) for features of an AWM program in the Murray Goulburn Valley (MGV), Sunraysia (SR) and Riverland* (RL)
NOTE: The WTP estimates provided here are average figures – which means that some people were willing to pay more and some to pay less, and some not willing to pay at all. However, the percentage of growers that preferred not to contribute to an AWM program at all was still only about 20%.
